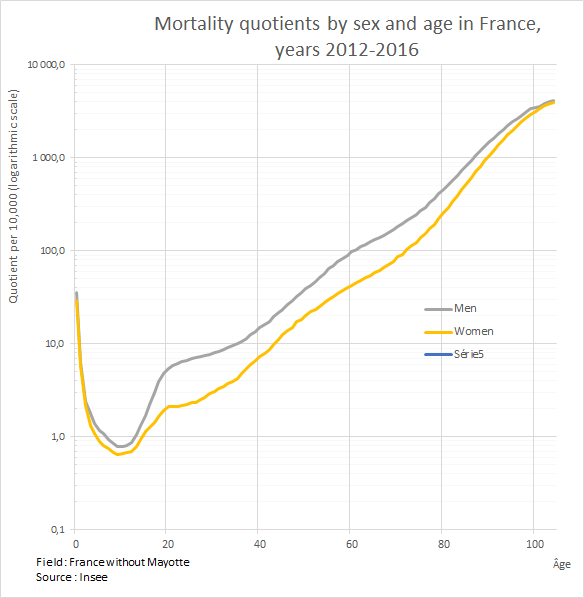
Age-specific mortality rates

Reading the graph
This graph presents the age- and sex-specific probabilities of dying during the year in France , i.e. the mortality rates for males and females at each age,
58/5000, for all people who survived until this age.
The calculations are based on deaths reported to France’s civil registration offices for each age and INSEE’s January 1 census-based estimates of the population of each age.
The estimates for three successive years - in this case 2012 to 2016 - are averaged to ensure sufficient accuracy, notably at young ages when deaths are very rare and significant random fluctuations.
The probabilities of dying vary between 0 and 1 for each individual, and are presented here "per 10,000" population. As variations with age are enormous (from 1 death per 10,000 at age 10 to 1 per 10 at age 85) a logarithmic scale is used. The vertical distance expresses the ratio (and not the difference) between the two values. For example, the y-coordinates 1 and 10 are the same distance apart as 10 and 100.
The mortality rate is very low during childhood, then increases exponentially from age 30; it is lower for females at all ages
From birth to first birthday, the risk of dying in France is very low today—30 in 10,000—and most of these deaths occur immediately after birth. From age 1 on, the probability of dying falls gradually, attaining minimum risk at age 10; annual risk from ages 4 to 14 is only one child in 10,000. Risk increases sharply in adolescence, to as high as 2 in 10,000 for girls and 5 in 10,000 for boys aged 20. It then rises exponentially by approximately 8% to 10% from one age year to the next, doubling every 8 to 9 years. From age 95, accurate estimation is complicated by errors in age reporting on the census and, for extremely old ages (105 and over), by the low number of living persons and therefore of deaths.
At all ages, men’s risk of dying is higher than women’s. Excess male mortality is highest from ages 20 to 30, during which time the risk of dying is three times higher for men than women of the same age.
Sources
- The data in this graph are taken from The French demographic situation in 2004 published by INSEE. They are available on the INSEE and INED websites
Udate : August 2018
