Households in France This graph shows the number of households enumerated in 2015 by number of members, from one (one-person households) to nine or more for the largest households. These 28.2 million households count 62.8 million individuals, represented on the graph. Read more
Triangle of meeting places Where do people first meet their spouse? The meeting places are divided into three categories (forming of the triangle) : public places, private places and semi-private places. Each side of the triangle has a scale: the proportion of partners met in a private place; in a semi-private place, and in a public place. Read more
World population by fertility (1950-2004) For each period, the graph plots the distribution of countries by their level of fertility. The countries are ranked by the mean number of children per woman. For each level of fertility, the curve shows the proportion of the world population living in a country where fertility is below that level. Read more
Age-specific fertility in Europe Ce graphique montre la fécondité par âge en Europe en 2016. Le taux de fécondité représente la probabilité à chaque âge de mettre au monde un enfant. Read more
Excess male mortality by age This graph shows the excess mortality of males with respect to females in France over the last 200 years. Excess male mortality is measured as the male/female ratio of the probability of dying at a given age, for different groups of years from the early 19th century to the early 21st century: 1820-1824, 1900-1904, 1950-1954, 1990-1994 and 2000-2004. Read more
Life expectancy in France this graph shows the variations in life expectancy in France from 1740 to 2020 Read more
Age-specific mortality rates This graph presents the age- and sex-specific probabilities of dying during the year in metropolitan France, i.e. the mortality rates for males and females at each age. Read more
Fertilty and infant mortality This graph shows the relationship between two demographic indicators : fertility and infant mortality. The values along the horizontal axis indicate the level of infant mortality in each country of sub-Saharan Africa over the period 2000-2004, i.e. The values along the vertical axis indicate the level of fertility in each country over the same period, expressed as the average number of children per woman. Read more
Natural increase and net migration in EU-15, in 2002 This graph shows natural population increase and net migration in the EU-15 countries in 2002. Each country is represented by a bar whose width is proportional to its population size per 1,000 inhabitants. The countries are ranked by their total growth rate (natural increase + net migration). Read more
Living with family beyond age 85 Les cartes présentant la cohabitation multigénérationnelle des personnes âgées au fil des recensements. Read more
Excess male mortality by age This graph shows the excess mortality of males with respect to females in France over the last 200 years. Excess male mortality is measured as the male/female ratio of the probability of dying at a given age, for different groups of years from the early 19th century to the early 21st century: 1820-1824, 1900-1904, 1950-1954, 1990-1994 and 2000-2004. Read more
Age-specific mortality rates This graph presents the age- and sex-specific probabilities of dying during the year in metropolitan France, i.e. the mortality rates for males and females at each age. Read more
Excess male mortality by age This graph shows the excess mortality of males with respect to females in France over the last 200 years. Excess male mortality is measured as the male/female ratio of the probability of dying at a given age, for different groups of years from the early 19th century to the early 21st century: 1820-1824, 1900-1904, 1950-1954, 1990-1994 and 2000-2004. Read more
2010 population pyramids of France and the European Union 
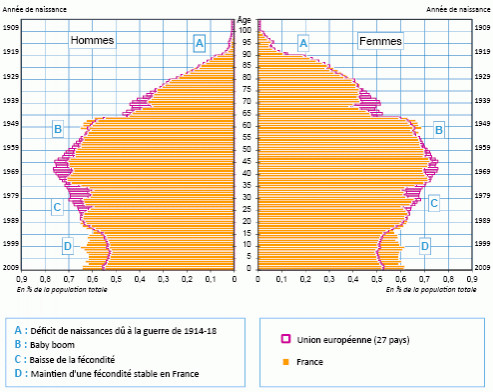
France’s population pyramid for 2010 was shaped by twentieth-century history: a birth deficit during the 1914-1918 war years, the baby boom of 1946-1973, relative birth rate stability for the past 35 years Read more
Age-specific mortality rates This graph presents the age- and sex-specific probabilities of dying during the year in metropolitan France, i.e. the mortality rates for males and females at each age. Read more
Pensions : three policy levers This graph is a calculation chart which shows the various options for balancing the French pensions system by 2020. It summarizes the range of different policies that could be implemented. To reach equilibrium, we can act upon one or more of the policy levers. Read more
Natural increase and net migration in EU-15, in 2002 This graph shows natural population increase and net migration in the EU-15 countries in 2002. Each country is represented by a bar whose width is proportional to its population size per 1,000 inhabitants. The countries are ranked by their total growth rate (natural increase + net migration). Read more
World population by fertility (1950-2004) For each period, the graph plots the distribution of countries by their level of fertility. The countries are ranked by the mean number of children per woman. For each level of fertility, the curve shows the proportion of the world population living in a country where fertility is below that level. Read more
Age-specific fertility in Europe Ce graphique montre la fécondité par âge en Europe en 2016. Le taux de fécondité représente la probabilité à chaque âge de mettre au monde un enfant. Read more
The population of the European Union (1957 - 2007) This graph presents the population of the European Union, from its initial formation, through successive enlargements, up to the present day. Read more
Fertilty and infant mortality This graph shows the relationship between two demographic indicators : fertility and infant mortality. The values along the horizontal axis indicate the level of infant mortality in each country of sub-Saharan Africa over the period 2000-2004, i.e. The values along the vertical axis indicate the level of fertility in each country over the same period, expressed as the average number of children per woman. Read more
Population growth 2000-2050 On these two world maps, the countries are represented by rectangles whose surface area is proportional to their estimated population in 2000 (top) and their projected population in 2050 (bottom). Both these population cartograms are constructed on the same scale, so the population change between the two dates can be compared. Read more
Human population growth Ce graphique représentant l'évolution du nombre des hommes se dessine sur deux axes : L'axe horizontal représente les années, de l'an -65 000 à l'an +5000. L'axe vertical indique l'effectif total de la population mondiale. Read more